Steven Vance's Bike Crash Map in Gaper's Block!
Replies to This Discussion
-
Permalink Reply by Steven Vance on
-
-
Permalink Reply by h' Zerocats on
-
Nice work. I've been wanting for several years to create a site to log incidents of (non-automotive) aggression against Chicago cyclists by incident type/description and location . . . would love to collaborate.
-
Permalink Reply by millenial removing Bernie tattoo on
-
No patterns really jump out.
-
Permalink Reply by magomawe on
-
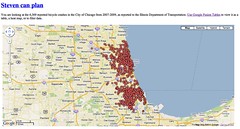
Milwaukee, Lawrence, Halsted, Lincoln, and North seem to have a higher degree of collisions (especially Milwaukee) when compared to areas that surround them. Of course they have more riders.
It also looks like there are a good amount of accidents at the intersections, though that's difficult to compare visually.
-
Permalink Reply by Duppie on
-
Steve,
That's very nice work you did. Too bad it doesn't contain any information on the specifics of the accident, but I assume that information wasn't included in the source data.
I would be nice if IDOT recorded a lot more detail about the accidents: Front v. rear, door or not, was the vehicle turning. Did the cyclist have appropriate lights. Was he wearing a helmet? What was the nature of the injuries, if any, etc.
Combine that with the volume of crashes (over 6000) and you can start to do some statistical analysis on causes which can lead to future improvements.
Regardless, very nice work
-
Permalink Reply by Melanie K on
-
The map is really interesting. Is there a way for people who have bicycle accidents/incidents that don't involve IDOT or the police to report their crashes, driver aggression and the circumstances, etc., whether an injury occurs or not - such as the bicycle being damaged by the accident, but no serious physical injury to the cyclist resulting from it?
-
Permalink Reply by Far'arned Retrogrumpalunkus #63 on
-
What's with the area on Milwaukee Street on the 2000-block right in front of CVS? It's like the Bermuda Triangle of bike crashes.
-
-
Visit the Google Fusion Tables-hosted version of the map. Then click on Visualize>Map. Then click on "Display as heat map."
The intersections will start appearing in colors (red is hottest, highest frequency), and green is coldest (lowest frequency). The more you zoom in, the more red disappears. But you will find that the Chicago/Ogden/Milwaukee is the "hottest" intersection.
Matt Wehrmann said:Milwaukee, Lawrence, Halsted, Lincoln, and North seem to have a higher degree of collisions (especially Milwaukee) when compared to areas that surround them. Of course they have more riders.
It also looks like there are a good amount of accidents at the intersections, though that's difficult to compare visually.
-
-
I do have injury severity data, which I mistakenly removed before uploading (and it took me a couple days to realize what I did). I plan to add it back. You won't need to change your bookmarks - the page will show the new map automatically.
Data IDOT collects comes from the Chicago Police Department. I believe the Chicago Police Department collects information such as dooring, right hook, left hook (as they are specific violations of the Municipal Code of Chicago). But this information does not get transferred into IDOT reports.
Duppie said:Steve,
That's very nice work you did. Too bad it doesn't contain any information on the specifics of the accident, but I assume that information wasn't included in the source data.
I would be nice if IDOT recorded a lot more detail about the accidents: Front v. rear, door or not, was the vehicle turning. Did the cyclist have appropriate lights. Was he wearing a helmet? What was the nature of the injuries, if any, etc.
Combine that with the volume of crashes (over 6000) and you can start to do some statistical analysis on causes which can lead to future improvements.
Regardless, very nice work
-
-
Very cool. That is the "hottest" intersection and Milwaukee seems to be the "hottest" street - likely as a result of the many riders on a narrow street. I'd guess a lot of those would be for dooring.
Steven Vance said:Visit the Google Fusion Tables-hosted version of the map. Then click on Visualize>Map. Then click on "Display as heat map."
The intersections will start appearing in colors (red is hottest, highest frequency), and green is coldest (lowest frequency). The more you zoom in, the more red disappears. But you will find that the Chicago/Ogden/Milwaukee is the "hottest" intersection.
Matt Wehrmann said:Milwaukee, Lawrence, Halsted, Lincoln, and North seem to have a higher degree of collisions (especially Milwaukee) when compared to areas that surround them. Of course they have more riders.
It also looks like there are a good amount of accidents at the intersections, though that's difficult to compare visually.
-
Permalink Reply by A.K.A Paul on
-
I havent looked at the map in great detail but there seems to be a relation with the density of bike accidents as a function of frequency of bike use.
Groups
-
Critical Mass discussion
262 members
-
Chicagoland Beer Explora…
203 members
-
Chicago Randonneurs
269 members
-
Walk Bike Transit
63 members
-
British Bicycles of Chic…
172 members
© 2008-2016 The Chainlink Community, L.L.C.
Powered by
![]()